11.6. Seepage Component to Pit
MINEDW provides functions to compute pit seepage
and visualize seepage locations.
Pit seepage is recorded in an .SEP file, including seepage during mining operations and
pit-lake formation. Seepage is recorded for each time
step at each node forming the open pit. The “Seepage Component
to Pit” function and .SEP file compute seepage by
geological unit or other user-specified divisions. This
output can be plotted or used in geochemical modeling for pit-lake
chemistry predictions. The “Pit Flux” plot item and .SEP
file visualize locations and relative magnitude of
seepage at any time step after mining starts.
This output assesses future dewatering needs and optimum
locations for in-pit dewatering solutions. The following sections explain the “Seepage Component to
Pit” function and “Flux” plot item.
11.6.1. Calculating Seepage to the Pit
The “Seepage Component to Pit” function computes total pit seepage and contributions from each geologic unit through time.
To compute seepage to the pit:
Click “Results” → “Seepage Component to Pit” on the Main Menu
Select the .SEP file from the folder where MINEDW was executed
Choose “Geological Units” to determine seepage rate from each geologic unit
Click the button at the bottom right to define output name and location
Enter a filename in the “Save Pit Flow File” dialog and click “Save”
Click “OK” to create the seepage file
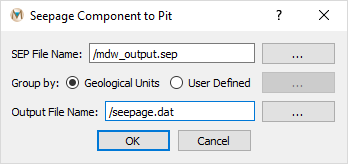
Figure 11.7 The “Seepage Component to Pit“ dialog box
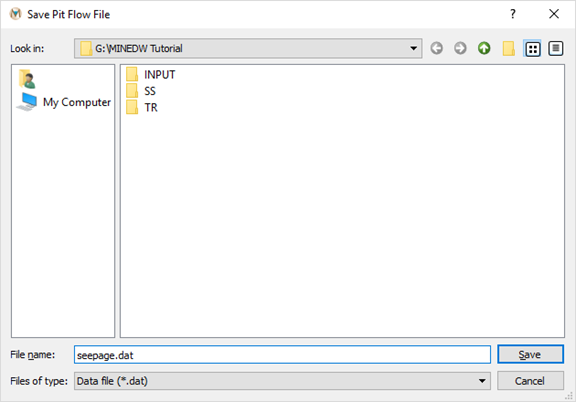
Figure 11.8 The “Save Pit Flow File“ dialog box
Import the created file to Excel or other graphing software to plot total seepage versus time (see Figure 11.9) and seepage from each geologic unit through time (see Figure 11.10).
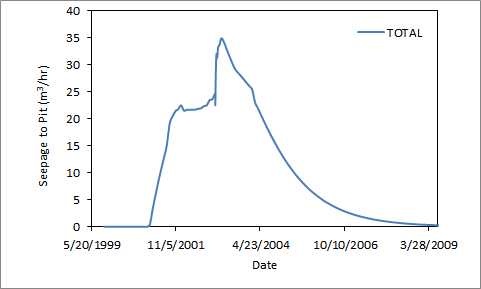
Figure 11.9 Total seepage to the pit through time
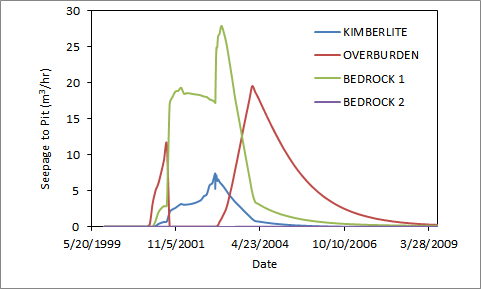
Figure 11.10 Seepage rate from each geologic unit through time
11.6.2. Visualizing Seepage and Drains
As previously mentioned, it is possible to visualize the location where seepage to the pit is occurring, as shown in Figure 11.11. To do this, expand the “Post Processing” item under the “List” tab in the “Control Panel” Pane. Add a “Flux” plot item to the View Pane by double-clicking it. On the “Attributes” tab for the “Flux” plot item, select “+” next to the “File” attribute. In the “Select Flux File” dialog box that opens, change the type of file to “Seepage Flux Files (mdw_output.SEP)” using the drop-down list next to “Files of Type.” Now navigate to the location where the model was executed and select the file ending in .SEP. The nodes where seepage to the pit occurred are visible as colored squares. The colors indicate the magnitude of seepage occurring at the node forming part of the open pit. The size and color ramp can be modified on the attributes tab of the “Flux” plot item.
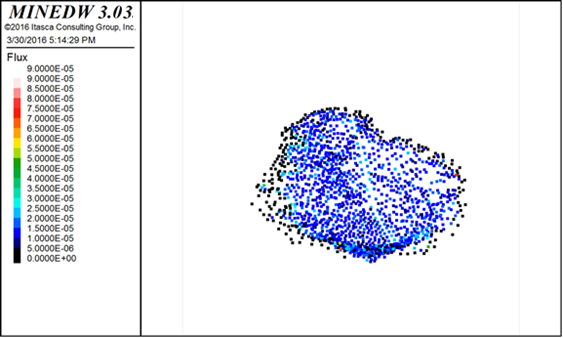
Figure 11.11 Visualizing seepage locations within the open pit
The “Flux” plot item can also be used to visualize the magnitude of flow through “Drain” boundary conditions. Seepage nodes that form the pit shell are considered drains and are automatically created when a mine plan is created (Mining Plan). “Drains,” in contrast, are created by the user and can be used to simulate sinks such as underground excavation, sub-horizontal drains, and sumps. The workflow for visualizing “Drains” is similar to the workflow for seepage, with one exception: instead of choosing “mdw_output.SEP,” select the “mdw_output.DRN” option if it is not already selected, then navigate to the .DRN file and select it. Flow through user-created drains is displayed in the View Pane. The size and color of the drain nodes can be altered using the “Contour” and “Point” attributes.
| Was this helpful? ... | Itasca Software © 2025 | Updated: Sep 23, 2025 |
