11.8. Export Results
11.8.1. Export State
MINEDW exports simulation data for all nodes to a
.DAT file.
2-D export options: X, Y, Elevation, Head, Pressure, Water Table, Drawdown, and Head Difference for each model layer.
3-D export options: X, Y, Elevation, Head, Pressure, and Head Difference.
To export data, select “Export State” from the “Results” menu. In the “Choose Export Items” dialog (see Figure 11.13), select the data set in “2-D” or “3-D” and click “OK” to generate the file.
Note: Without X or Y selected, data exports as a value list ordered by node number (1 to n) matching the “node.fem” file. Selecting X, Y, and Elevation adds coordinates to each exported value.
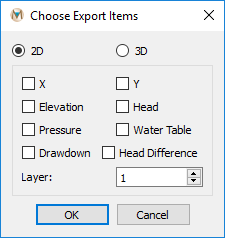
Figure 11.13 The “Choose Export Items“ dialog box with “2D“ selected
11.8.2. Exporting Pore Pressure
To export 3-D pore pressures:
Click “Results” → “Export Pore Pressure” from the Main Menu
Select folder and enter filename in the “Output Pore Pressure” dialog (see Figure 11.14).
Click “Save” to open the “Grid-Export Pore Pressure” dialog
Choose interpolation method and define parameters (see Figure 11.15)
Set minimum and maximum x, y, and z coordinates
Define number of lines (grid spacing) and click “OK”
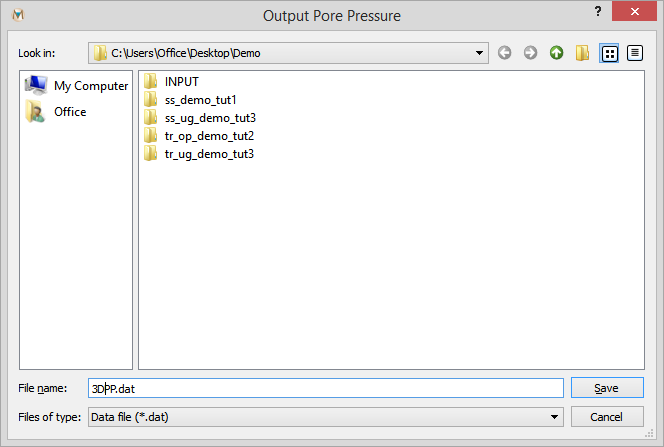
Figure 11.14 The “Output Pore Pressure“ dialog box
Grid-Export Parameters:
- Inverse Distance:
Inverse-distance interpolation method.
- Kriging:
Kriging interpolation method.
- Number of Points to Search:
Data points for interpolation.
- Power:
Exponent for inverse-distance method.
- Range:
Kriging method range.
- X, Y, Z Direction (Minimum, Maximum):
Export region boundaries.
- # of Lines (X, Y, Z):
Grid spacing in each direction.
- Save:
Save parameter file.
- Open:
Load saved parameter file.
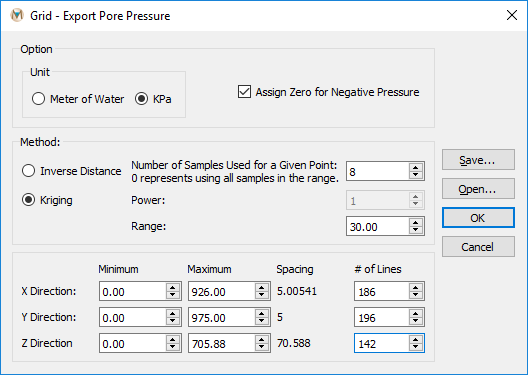
Figure 11.15 The “Grid – Export Pore Pressure“ dialog box
The pore pressures are be interpolated to the defined grid and saved in a .DAT file. The .DAT file includes x, y, and z coordinates as well as pore pressures.
11.8.3. Export Cross-Section Pore Pressure
MINEDW can export the pore pressures in both 2-D and 3-D to a .DAT file with a specified grid space and dimensions for geomechanical models. To export the pore pressures in a cross section (2-D), click “Results” from the Main Menu banner and then choose “Export Cross-Section Pore Pressure.” The “Output Cross-Section Pore Pressure” dialog box appears (see Figure 11.16).
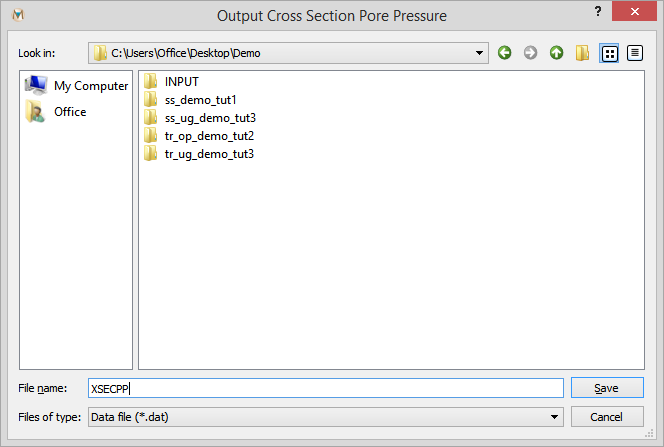
Figure 11.16 The “Output Cross-Section Pore Pressure“ dialog box
Select the folder and type a file name at the bottom of the “Output Cross-Section Pore Pressure” dialog box and click “Save.” The “Grid – Export Cross-Section Pore Pressure” dialog box appears. Choose the interpolation method (Inverse Distance or Kriging) and define the related parameters (see Figure 11.17). The options for this menu are described below.
- Inverse Distance:
Option to use the inverse-distance method for interpolation.
- Kriging:
Option to use the kriging method for interpolation.
- Number of Points to Search:
Data points to use in the kriging or inverse-distance method.
- Power:
Power used in the inverse-distance method.
- Range:
Range used in the kriging method.
- Vertical (Minimum, Maximum):
The height (Minimum Z, Maximum Z) of the cross section to be exported.
- Start X/Y:
The starting location of the cross section.
- End X/Y:
The ending location of the cross section.
- # of Lines (Horizontal, Vertical):
The discretization in the x and y directions.
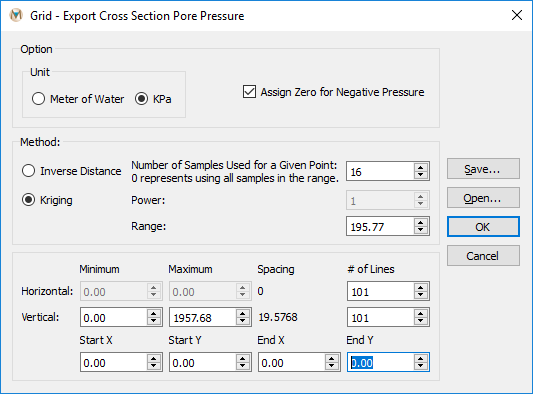
Figure 11.17 The “Grid – Export Cross-Section Pore Pressure” dialog box
Define the minimum and maximum x and y coordinates of the cross section and the number of lines (changing the number of lines changes the grid space), then click “OK.” The pore pressures are interpolated to the defined grid and are saved in a .DAT file. The .DAT file includes x and y coordinates as well as pore pressures.
11.8.4. Drawdown-Base Time Step
The “Drawdown-Base Time Step” option enables users to select a date from which drawdown is calculated. In most cases, the initial date is the first time step of the simulation. If the drawdown is to be calculated using a different time step, then the date for the first time step should be entered. Select “Drawdown-Base Time Step” from the “Results” drop-down menu to open the “Define Drawdown Initial Date/Time” dialog box (see Figure 11.18).
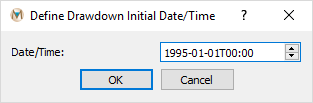
Figure 11.18 The “Define Drawdown Initial Time/Date“ dialog box
| Was this helpful? ... | Itasca Software © 2025 | Updated: Sep 23, 2025 |
