Capillary Infiltration in a Dry Caisson (FLAC2D)
Problem Statement
Note
This project reproduces Example 2.5.2 from FLAC 8.1. The project file for this example is available to be viewed/run in FLAC2D.[1]. The project’s main data files are shown at the end of this example.
This numerical simulation analyzes the flow of water driven by capillary suction in a dry caisson filled with a porous material. The caisson is 30 m in width and 20 m in height with an initial homogeneous saturation of \(S_w\) = 0.01. The top left side of the caisson is in contact with water along a 3 m inlet. The right side is exposed to air at atmospheric pressure. The effect of gravity is neglected in this model, which is designed to test the ability of FLAC2D to model fluid flow driven by capillarity. The fluid properties are given in Table 1.
Property |
Value |
|---|---|
Porosity |
0.4 |
Sat. mobility coefficient |
1 \(\times\) 10-6 m2/Pa s |
Intrinsic permeability |
1 \(\times\) 10-9 m2 |
Wetting-phase viscosity |
1.0 cP |
Wetting-phase compressibility |
0.001 kPa-1 |
Rock compressibility |
0.0 kPa-1 (rigid) |
Residual saturation |
0.0 |
van Genuchten \(m\) |
0.5 |
van Genuchten \(n\) |
2.0 |
van Genuchten \(p_{ref}\) |
800 kPa |
Rel. permeability exponent \(b\) |
0.5 |
The modeling domain is discretized by 20 zones in each direction, with a total of 400 zones. At the water inlet (top, left side of the model), saturation is fixed at \(S_w\) = 1.0. The right and bottom sides of the model are closed. Infiltration is allowed to take place for a period of 140 seconds. Rock compressibility is assumed to be zero (i.e., rigid). Moreover, the relative permeability of the wetting-phase is given by:
where \(k_{rw}\) is the relative permeability of the wetting-phase, \(S_{w}\) is the water saturation, \(b\) is the relative permeability exponent, and \(m\) is a van Genuchten fitting parameter.
Changes in wetting-phase fluid pressure follow Equations (2) and (3) in example problem Saturation and Drainage of a Caisson, and will not be repeated here.
Results
Figure 1 shows the evolution of saturation at monitoring points indicated in Figure 2 for the first 140 seconds after the caisson is placed in contact with water. It is clear that 140 seconds is enough time for the saturation front to reach all monitoring points. Contours of saturation at the end of the infiltration period are shown in Figure 2. Lastly, the partially-saturated fluid compressibility (inverse of Biot modulus) is shown in Figure 3.
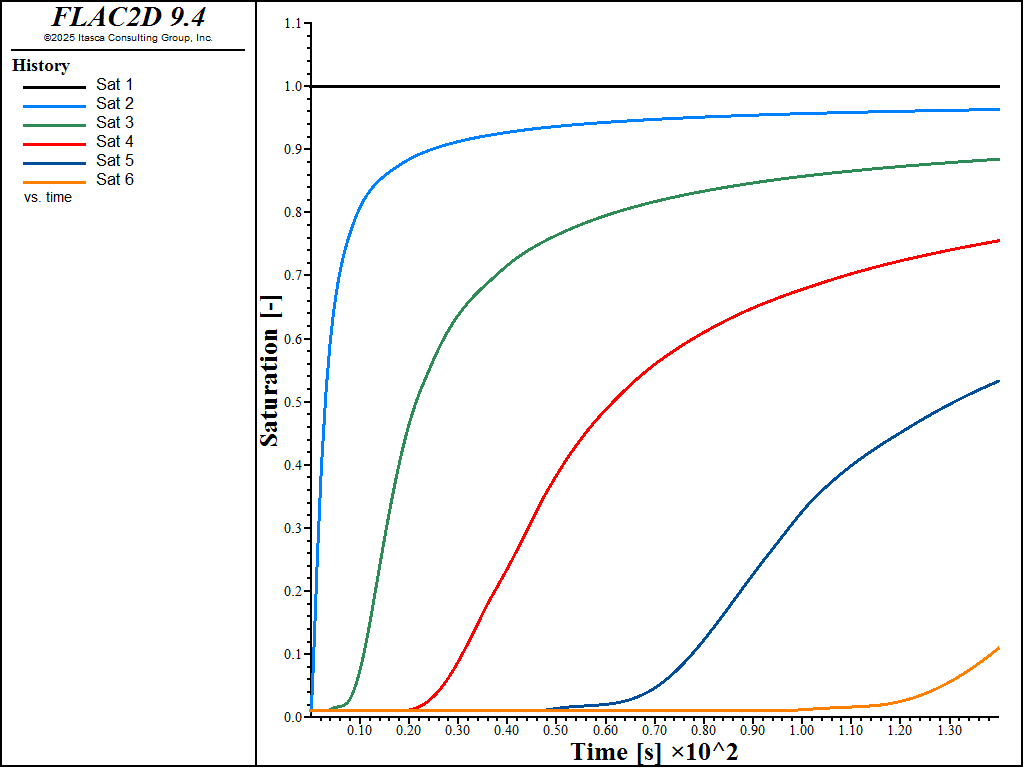
Figure 1: Wetting-phase saturation history at select monitoring points.
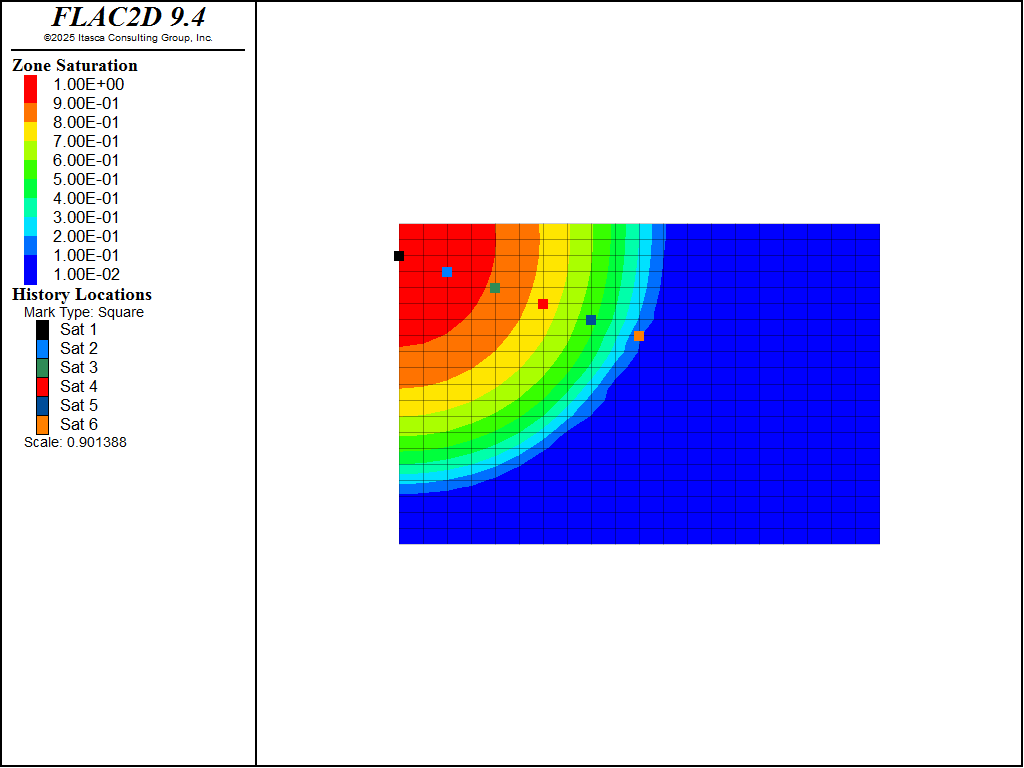
Figure 2: Saturation contours and history monitoring points at the end of the infiltration period.
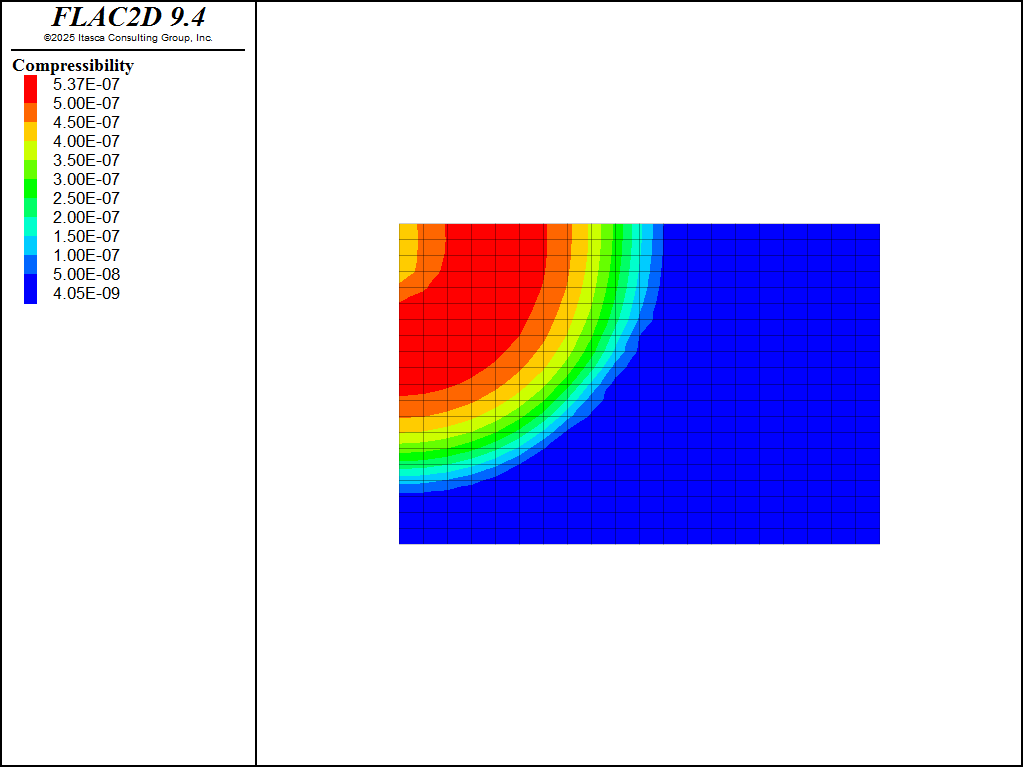
Figure 3: Fluid compressibility contours at the end of the infiltration period. Fully saturated compressibility is \(4 \times 10^{-7}\) Pa-1.
Data Files
capillary_infiltration.dat
model large-strain off
model configure fluid-flow
model gravity 0 -10

[Cw = 1e-6]   ; Wetting phase compressibility [1/Pa]
[Cnw = 1e-3]  ; Non-wetting phase compressibility [1/Pa]

[n = 2.0]     ; Van-Genuchten n
[m = 0.5]     ; Van-Genuchten m
[pr = 8e5]    ; Van-Genuchten pref [Pa]
[b = 0.5]     ; Relative permeability exponent

program call "functions"

zone create quadrilateral size 20 20 ...
    point 0 (0,0) point 1 (30,0) ...
    point 2(0,20)

zone fluid property fluid-density 1000 porosity 0.4 ...
    mobility-coefficient 1e-6 fluid-modulus [1/Cw]
zone fluid unsaturated van-genuchten [n] [m] [pr]

[init_pp]
[rel_perm]
[set_history]

zone fluid permeability-saturation table "krw"
zone face apply pore-pressure 0 range position-x 0 position-y 17 20
zone gridpoint initialize saturation 1 range position-x 0 position-y 17 20

fish callback add apparent_Cw -1 interval 10

model solve-fluid time-total 140
functions.dat
;------------------------------------------------------;
; Functions: Capillary Infiltration in a Dry Caisson.
;------------------------------------------------------;

fish define init_pp
    ; Initialize constant initial pore pressure
    local Swi = 0.01
    local pi = 1e5 - pr * (Swi^(-1.0/m)- 1.0)^(1.0 - m)
    gp.pp(::gp.list) = pi
    gp.sat(::gp.list) = Swi
end

fish define rel_perm
    ; Wetting phase relative permeability
    local tab = table.create("krw")
    loop for(local i = 0.01, i <= 1.0, i += 0.01)
        krw = i^(b)*(1.0 - (1.0 - i^(1/m))^m)^2
        table(tab, i) = krw
    endloop
end

fish define apparent_Cw
    ; Compute the inverse of water Biot modulus
    local Sw = gp.sat(::gp.list)
    local phi = zone.fluid.prop(zone.near((0,0)), "porosity")
    local Nw = phi * Sw * Cw
    gp.extra(::gp.list, 1) ::= Nw

    local pc = -gp.pp(::gp.list)
    local ispos = pc > 0.0
    local gps = gp.list(ispos)
    pc = -gp.pp(::gps)

    local dSwdPc = -m*n*(pc/pr)^n*((pc/pr)^n + 1)^(-m - 1)/pc
    gp.extra(::gps, 1) -=:: phi * dSwdPc
end

fish define set_history
    ; Set history locations from FLAC 8.1 i,j grid
    xdim = 30
    ydim = 20
    nx = 20
    ny = 20

    command
      fish history name "time" [fluid.time.total]
      zone history name "_sat1" saturation position ([xdim*0/nx],[ydim*18/ny])
      zone history name "_sat2" saturation position ([xdim*2/nx],[ydim*17/ny])
      zone history name "_sat3" saturation position ([xdim*4/nx],[ydim*16/ny])
      zone history name "_sat4" saturation position ([xdim*6/nx],[ydim*15/ny])
      zone history name "_sat5" saturation position ([xdim*8/nx],[ydim*14/ny])
      zone history name "_sat6" saturation position ([xdim*10/nx],[ydim*13/ny])
    endcommand
end
⇐ Saturation and Drainage of a Caisson (FLAC2D) | Deformation Caused by Filling of a Caisson (FLAC2D) ⇒
| Was this helpful? ... | Itasca Software © 2024, Itasca | Updated: Jun 07, 2025 |
